

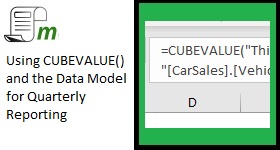
Cube formulas have been around in Excel for a long time. Not like VLOOKUP (which has been around since the beginning)… but they have existed since 2007. These formulas were initially designed to extract values from SSAS cubes. However; with …
Category: power pivot
Power Query – Clean data for the Data Model

In previous exercises, we used the FILTER() function in order to remove the totals from our data model. Using Power Query, clean data is provided to the data model. Filtering before the data model improves the performance of the model, …
ALL() and CALCULATE() – Percentage of a column

In the last post, we started using the CALCULATE() function to filter out some of the values that we didn’t want on our totals. This was done in order to get a pivot table that didn’t need to use the …
FILTER and CALCULATE – Removing pre-calculated totals.

In the last post, we started using the CALCULATE() function to filter out some of the values that we didn’t want on our totals. This was done in order to get a pivot table that didn’t need to use the …
Sum of a row using CALCULATE()

In the last post, we created a custom field in the Excel data model; however, we still needed to use Excel formulas to calculate the percentage of a row. In this example, we will be using a simple CALCULATE() function …
Custom Field for Quarterly Data in the Data Model

As part of the Quarterly Report case study, we built a report using the data model, but there were still some instances where we used Excel formulas. In this post, we will be creating a custom field so that there …
Quarterly Report – Using the Data Model
In this post, along prior two posts, I discussed a hypothetical case where data has been provided and your job (as the analyst) will be to create a quarterly report detailing sales of 2018 new vehicles in Canada. This post …