Skip to content (Press Enter)
  • Home
  • Services
  • Blog
  • Case Studies
  • About Me
Macrordinary

Macrordinary

  • Home
  • Services
  • Blog
  • Case Studies
  • About Me
Home>pivot table

Tag: pivot table

Updated on August 19, 2020August 19, 2020/ Brent Allen

Cube Formulas – The Best Excel Formulas You’re Not Using

Cube Formulas – The Best Excel Formulas You’re Not Using

Cube formulas have been around in Excel for a long time. Not like VLOOKUP (which has been around since the beginning)… but they have existed since 2007. These formulas were initially designed to extract values from SSAS cubes. However; with …

Read More
Updated on March 4, 2020March 4, 2020/ Brent Allen

Using Shapes for Better Dashboards

Using Shapes for Better Dashboards

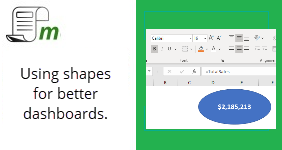
In most cases when working with data in Excel, you will be adding data directly into cells, or deriving data through pivot tables or formulas. But when working with dashboards, it is important to consider visual elements for end users. …

Read More
Updated on February 25, 2020February 25, 2020/ Brent Allen

3 different ways to get unique values in Excel

3 different ways to get unique values in Excel

It is very common to require a list of unique values from a list that contains duplicates. While it may be easiest to take a single approach to get these values, there are cases where a different approach may be …

Read More
Updated on January 30, 2020January 30, 2020/ Brent Allen

What is Advanced Excel?

What is Advanced Excel?

Advanced Excel is a skill that is in high demand. A quick query on LinkedIn showed over 68,000 jobs worldwide requesting advanced Excel, as of January 2020. The jobs that were showing on LinkedIn are generally for financial jobs, such …

Read More
Updated on November 27, 2019November 7, 2019/ Brent Allen

Quarterly Report – Pivot Table

Quarterly Report – Pivot Table

In this post, along with the next few posts, I will be discussing a hypothetical case where data has been provided and your job (as the analyst) will be to create a quarterly report detailing sales of 2018 new vehicles …

Read More

Recent Posts

  • Non-Unique List in Excel: Showing Only Duplicates
  • BYROW() in Excel: A Marginal Tax Schedule Example
  • Unique Values from 2 Lists in Excel – Multiple Methods
  • LAMBDA() in Excel – Generating an Amortization Schedule
  • LET Function in Excel: A Name Parsing Example

Categories

  • dashboards
  • excel
  • financial formulas
  • formulas
  • M
  • office script
  • pivot tables
  • power apps
  • power bi
  • power pivot
  • power platform
  • power query
  • scripts
  • VBA
Copyright © 2025 Macrordinary. Software Company | Developed By Rara Theme. Powered by WordPress.